
Table of Contents
1. What Is a Doji Candlestick? Reading Market Balance Through the Wicks
If you’ve spent any time looking at stock charts, you’ve probably come across a candle with little or no visible body, often resembling a cross.
This is called a Doji Candlestick.
In our last post, we covered the basics of bullish and bearish candles. With those, the opening and closing prices are different: a bullish candle closes higher than it opened, while a bearish candle closes lower than it opened. A Doji is different — here, the opening and closing prices end up at nearly the same level.
But that does not mean the price stayed still. It may have moved up and down significantly during the period, but by the end, it returned close to its opening level. In other words, a Doji is not a conclusion—it is more like a question: “Buyers and sellers reached a temporary balance, so which side will take control next?”
Why Does a Doji Form?
Think of each candle as a record of the tug-of-war between buyers and sellers over a given time period. A bullish candle shows that buyers had the upper hand, while a bearish candle shows that sellers had the upper hand. A Doji appears when neither side manages to gain a clear edge.
During that trading period, price might rise and then get pushed back down by sellers, leaving an upper wick. Or it might fall and then get pushed back up by buyers, leaving a lower wick. But if the closing price ends up close to the opening price, the candle essentially finishes right back where it began.
That said, don’t jump to conclusions from a single Doji alone. Seeing one doesn’t mean “the price is about to go up” or “the price is about to go down.” The more accurate takeaway is: “pay closer attention to what happens next.”
When you spot one, its slight bullish or bearish color matters far less than its position and wick structure.
Remember : a Doji is read by its balance and its wicks, not by its color.
The Four Types of Doji Candlesticks
| Type | Shape | Interpretation |
| Standard Doji (Cross Doji) | Upper and lower wicks about equal | Buyers and sellers in balance |
| Dragonfly Doji | Long lower wick, little/no upper wick | Buying emerging near lows |
| Long-Legged Doji | Both upper and lower wicks long | High volatility, price returns to origin |
| Gravestone Doji | Long upper wick, little/no lower wick | Selling emerging near highs |
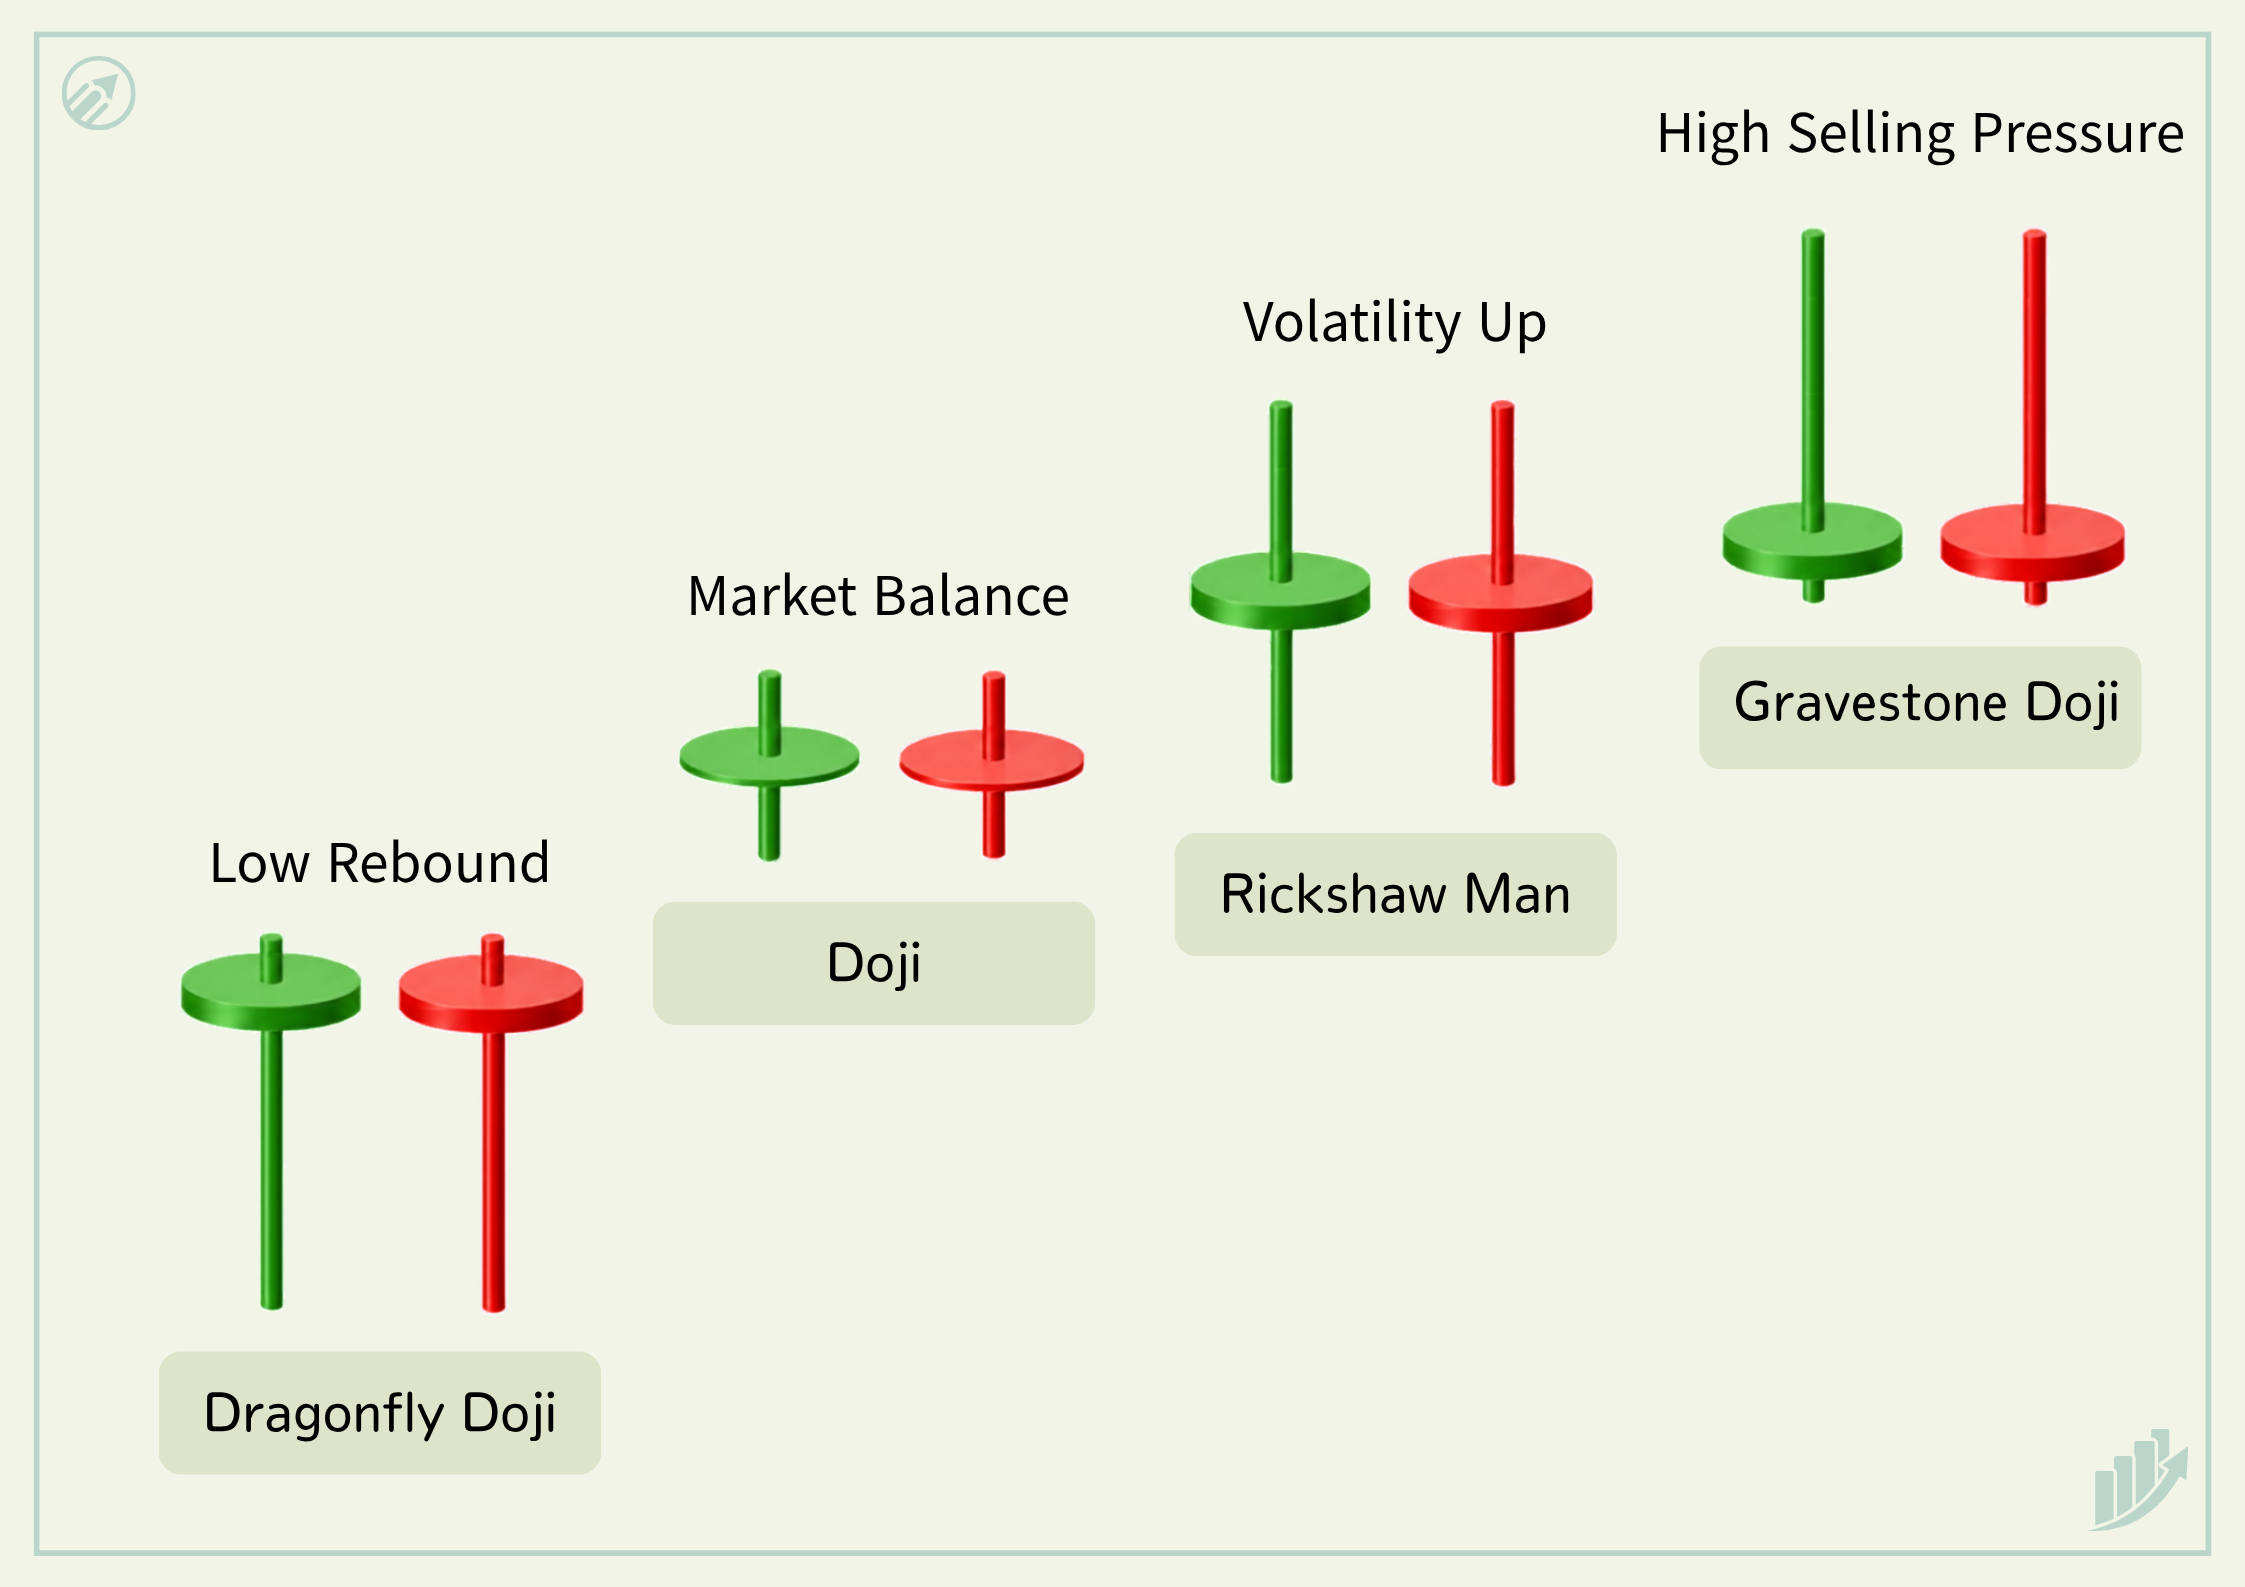
A Dragonfly Doji forms when sellers push the price lower, but buyers drive it back near the opening level by the close. Near the bottom of a downtrend, it may signal a possible bullish reversal.
A Gravestone Doji is the opposite: buyers push the price higher, but sellers drive it back near the opening level by the close. Near the top of an uptrend, it may signal a possible bearish reversal.
A Long-Legged Doji has long upper and lower wicks. Price swings widely in both directions but closes near its opening level, showing high volatility without a clear winner.
The Most Important Question: Where Did the Doji Appear?
Don’t judge a Doji by its shape alone. What really matters is where it appeared.
| Location | Interpretation |
| Middle of uptrend | Temporary pause |
| Near high, uptrend | Possible bearish reversal (Gravestone) |
| Middle of downtrend | Temporary pause |
| Near support, downtrend | Possible bullish bounce (Dragonfly) |
| Sideways, low volume | Not very meaningful |
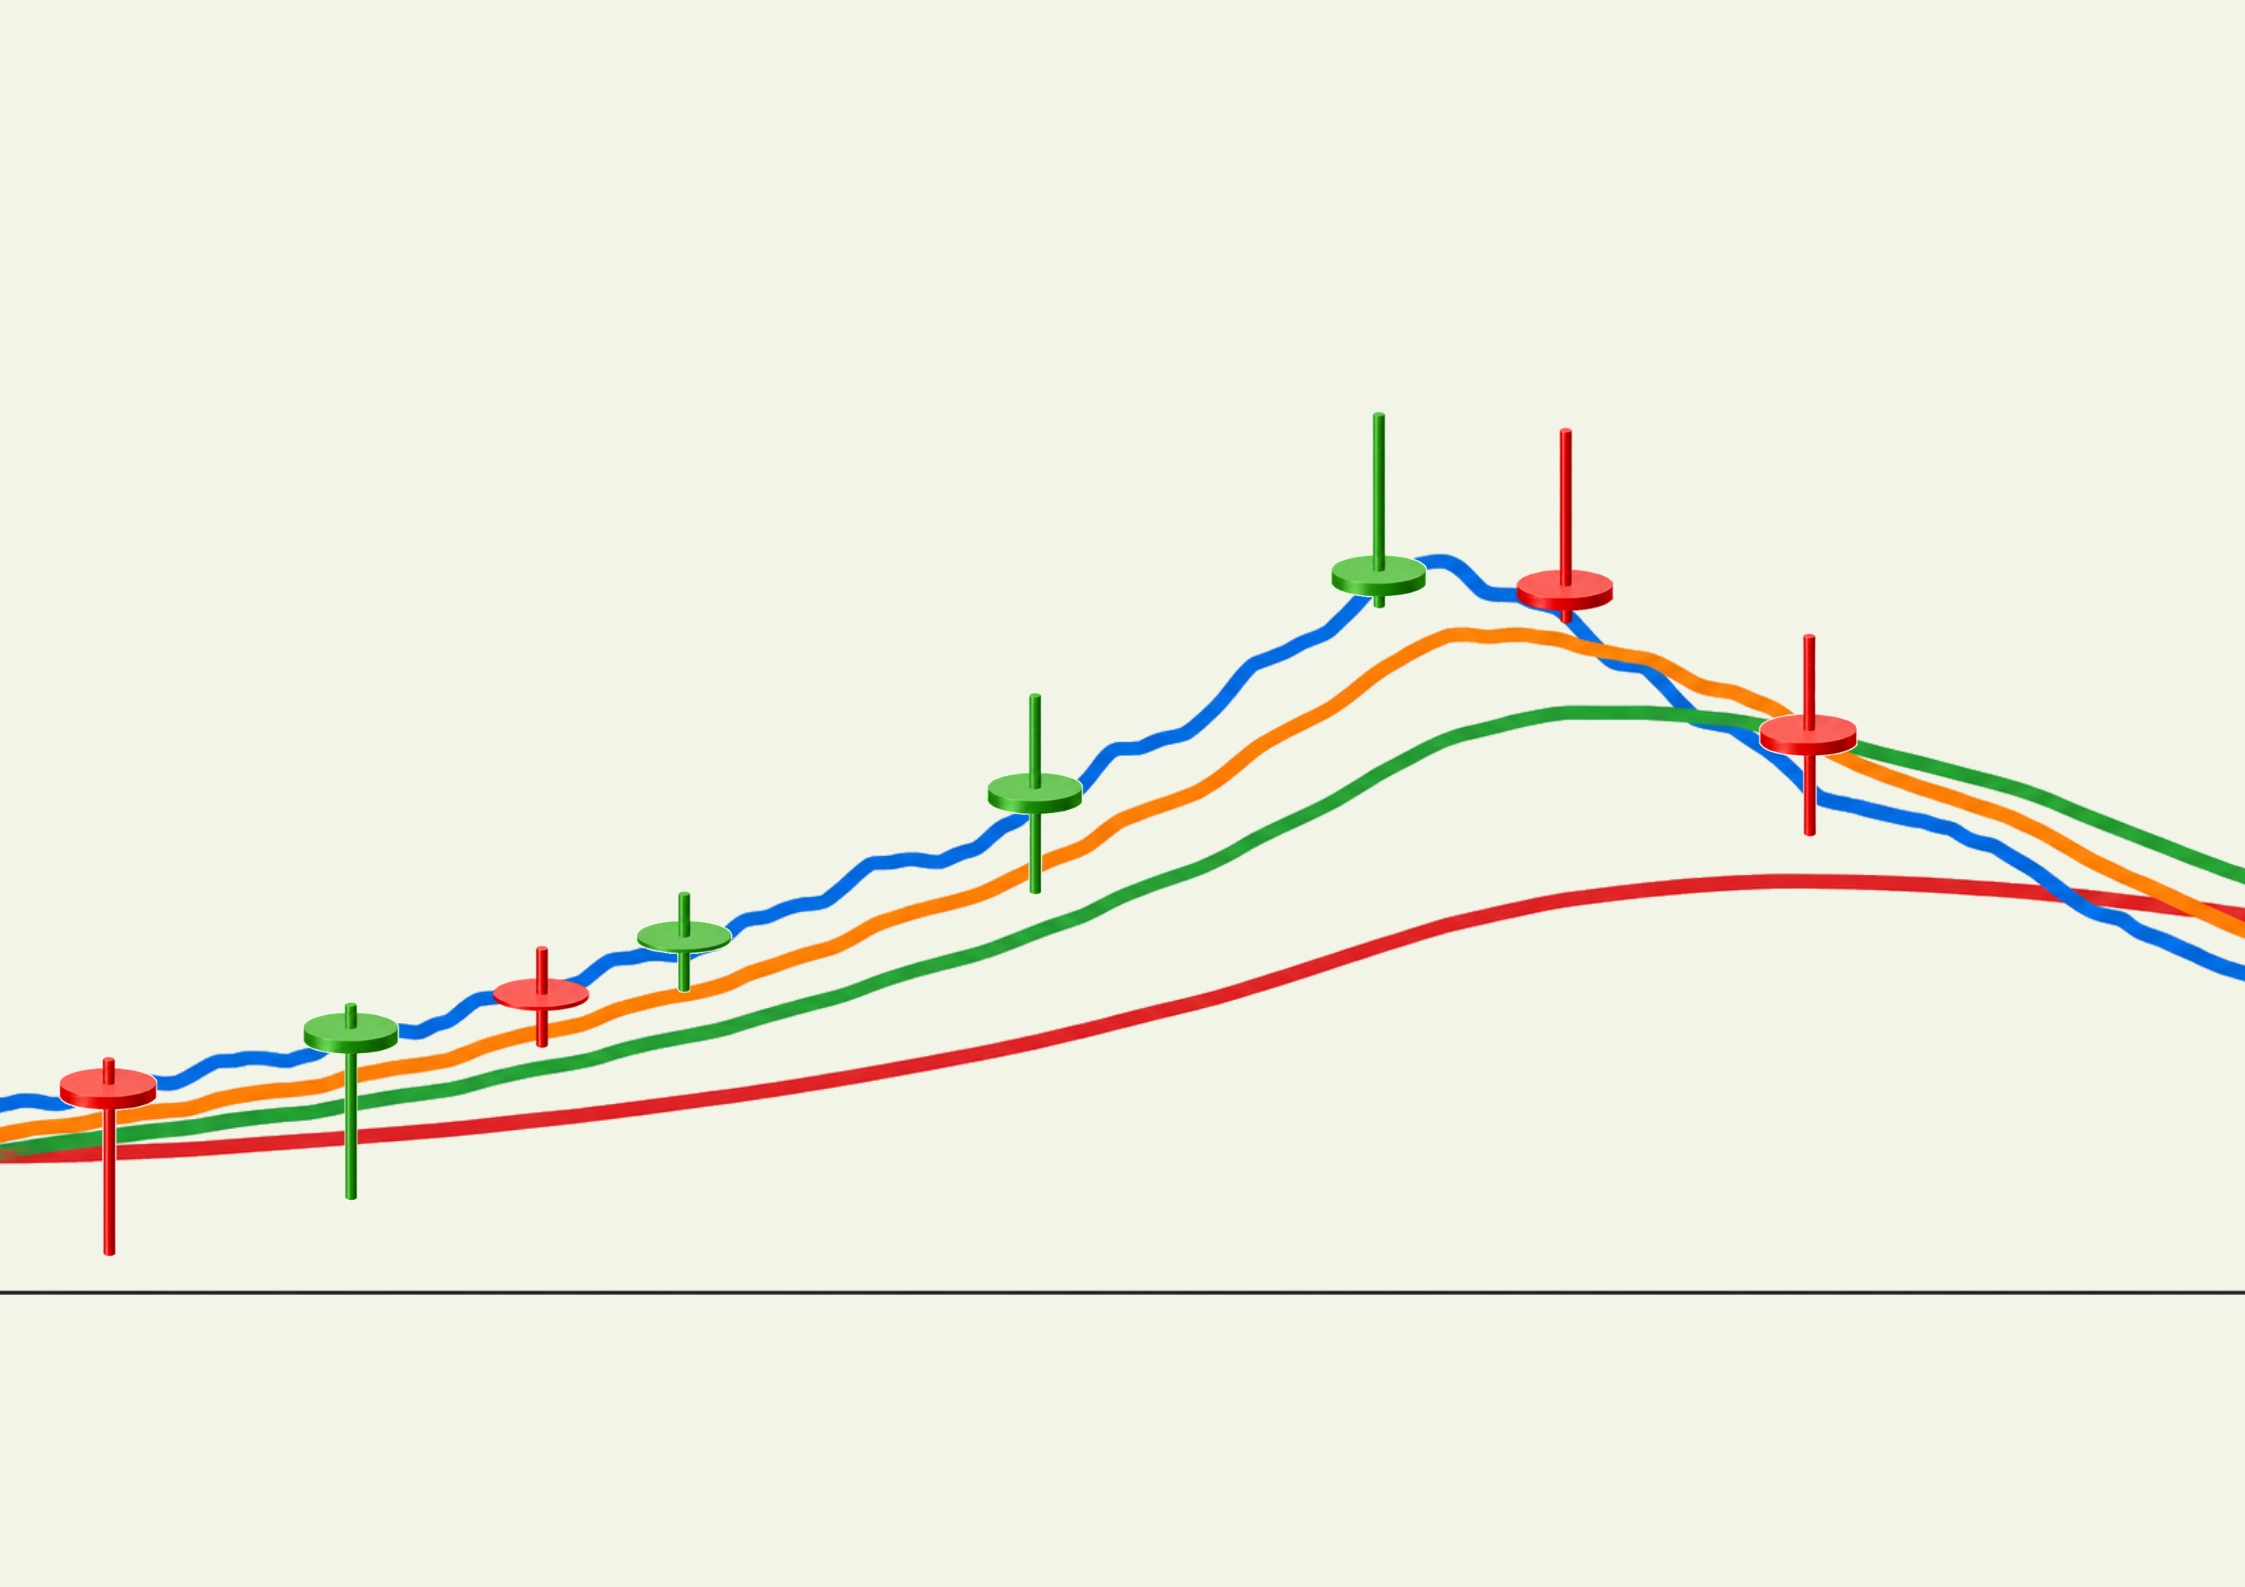
Whenever you spot one, ask yourself: “Did this appear in the middle of a trend, or near a possible turning point?” A Doji in the middle of a steady trend may simply reflect a brief pause, while one near a recent high or low may deserve closer attention.
Checklist for Evaluating a Doji
| Check | What to Look At |
| Location | Long uptrend, long downtrend, or sideways range |
| Wicks | Upper wick dominant vs. lower wick dominant |
| Volume | Recent increase or decrease around this point |
| Next Candle | Direction of the candle that follows |
If a strong bullish candle follows the Doji Candlestick, buyers may be gaining control—especially if it closes above the Doji’s high. A strong bearish candle may indicate growing seller control, especially if it closes below the Doji’s low. A Doji should not be read alone; look for confirmation in the price action that follows.
2. A Signal to Watch, Not a Verdict
Think of It as a Signal to Watch
A Doji does not tell you exactly where the market will go next, but it can help you recognize when the market’s direction is becoming uncertain. It’s a signal that the market has reached a temporary balance, and the next move needs to be confirmed.
Doji signal = market balance + key location + confirmation from subsequent price action
When you see one, don’t rush to buy or sell. Run through the checklist above before deciding — location, wicks, volume, and the next candle. A Doji isn’t the answer — it’s the starting point.
One of the most common mistakes new traders make is entering a trade based on a single Doji. A Doji doesn’t mean “act now” — it means “watch closely.”
Next time you look at a chart, mark each Doji and observe what happens next. Over time, this exercise will help you distinguish meaningful signals from normal market noise.