
Table of Contents
1. Same Shape, Different Name — The Power of Position
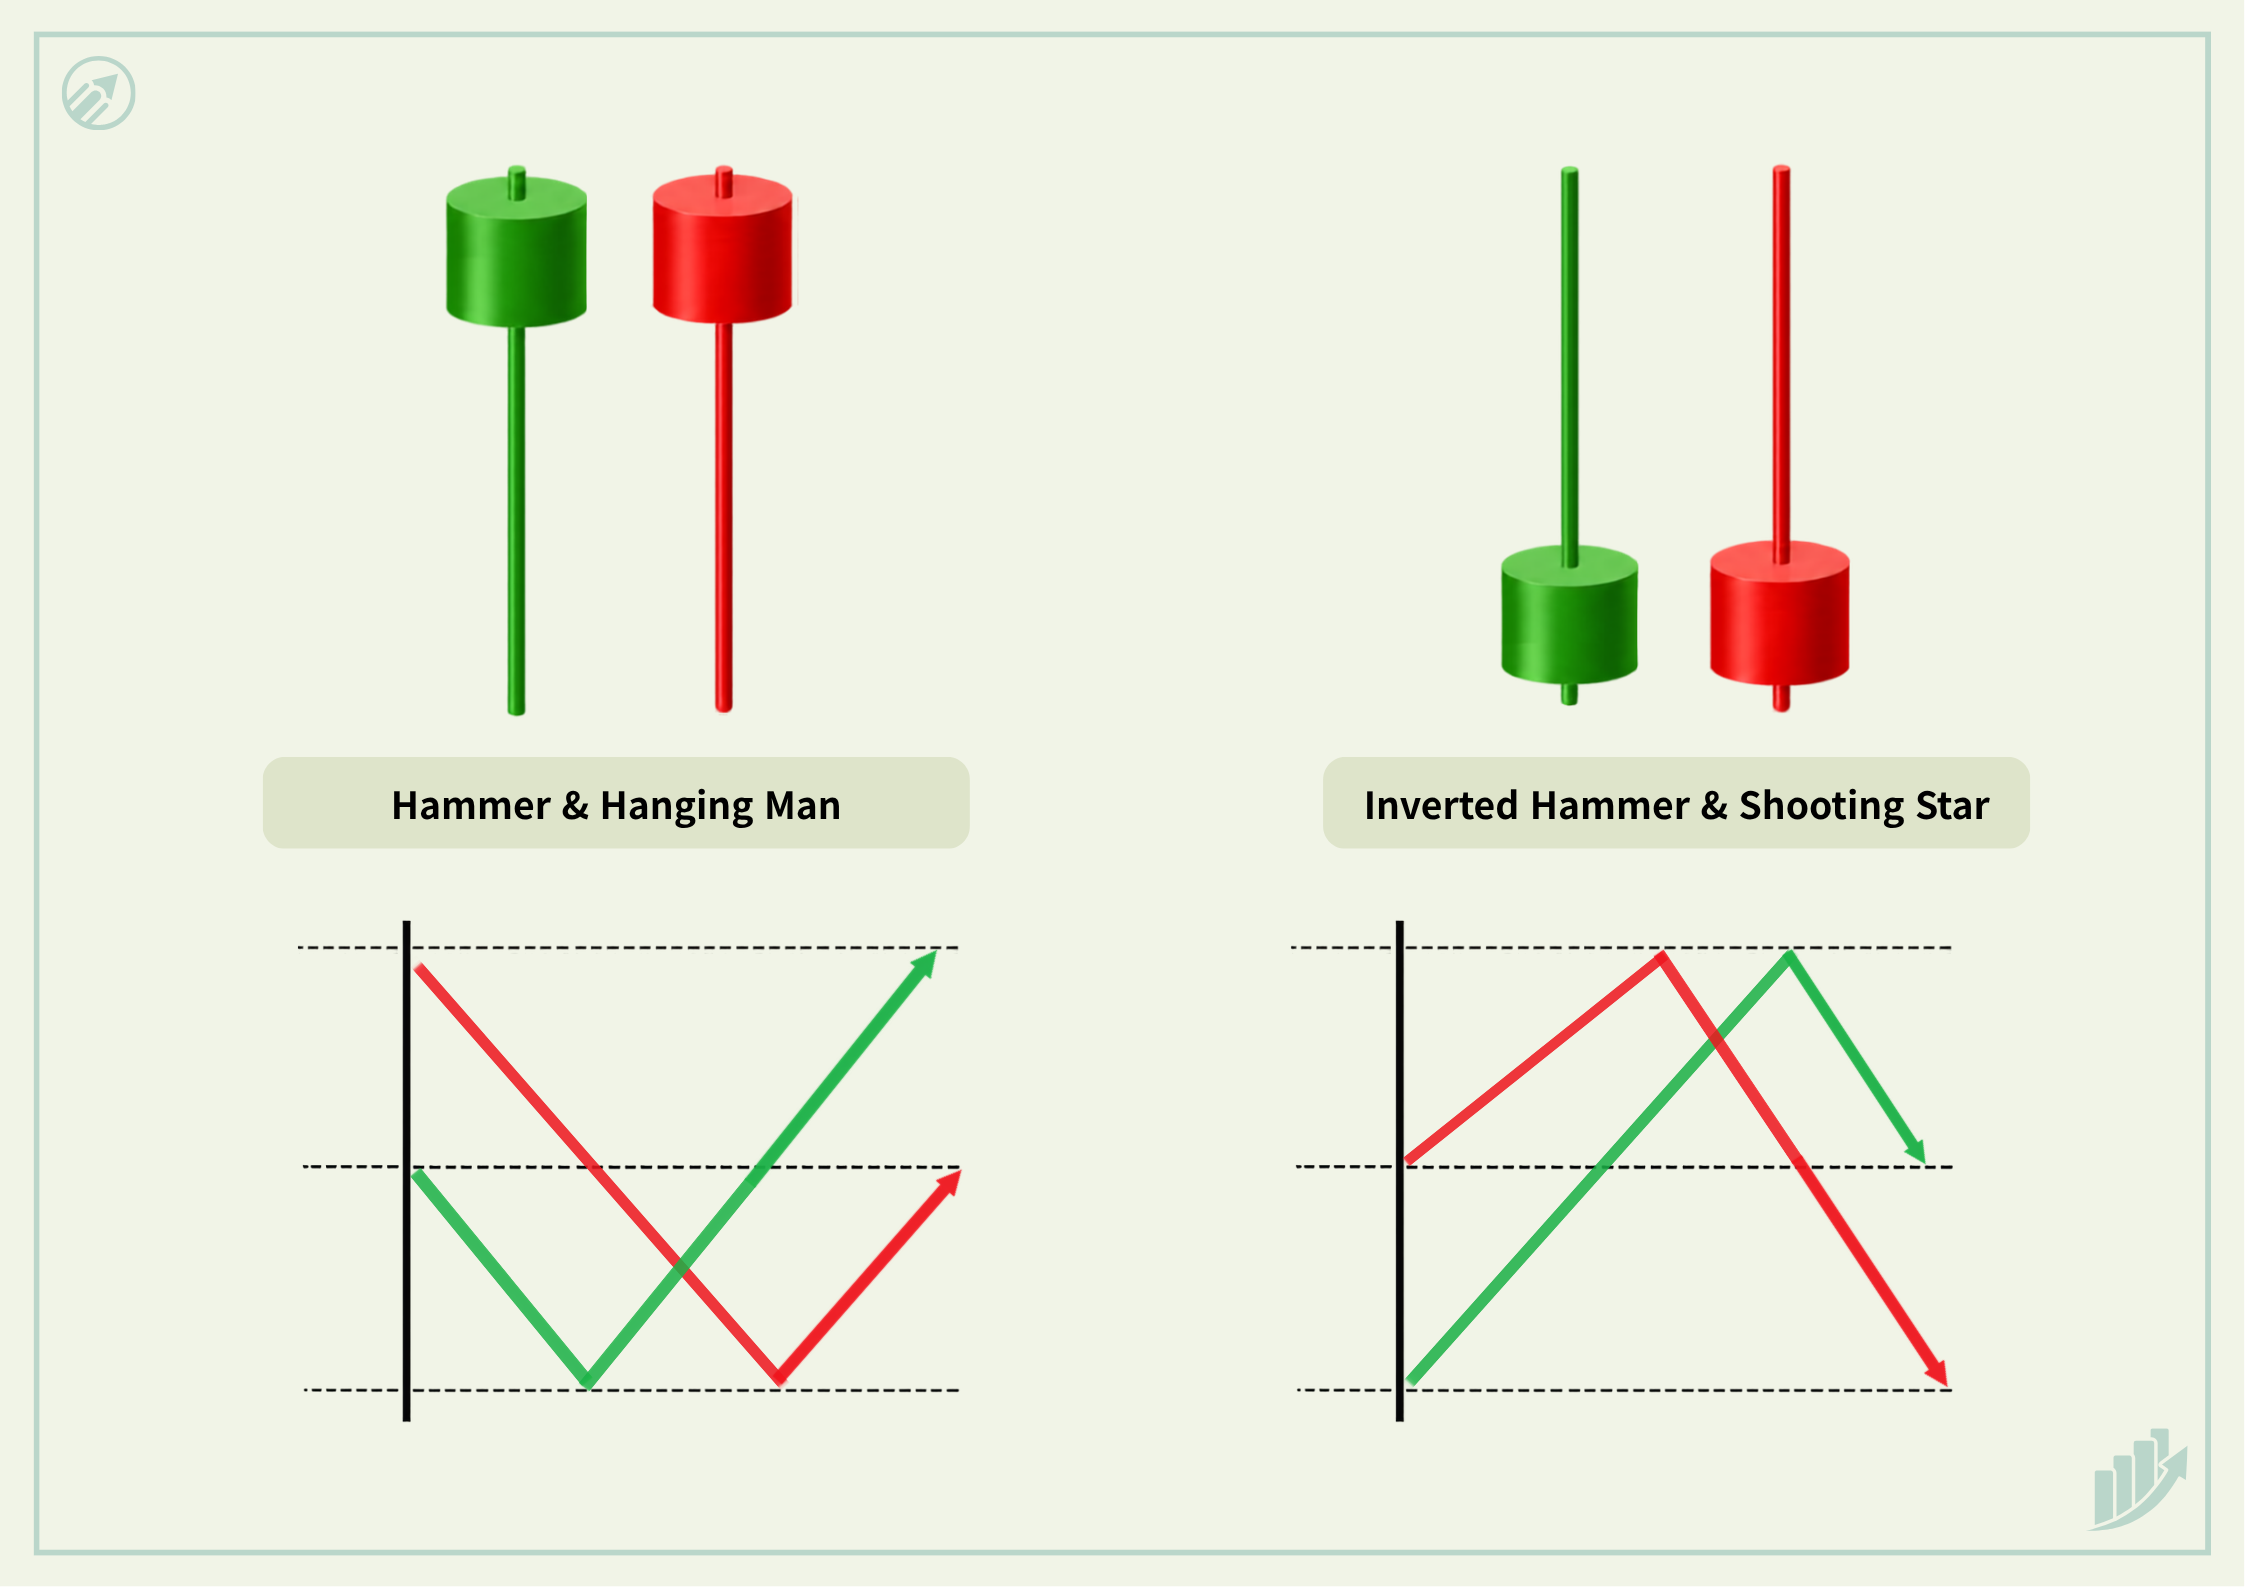
When looking at stock charts, you’ll sometimes come across a distinctive candlestick shape: a short body with a long wick, also called a shadow, extending either downward or upward, resembling a hammer. What this candle is called — and what it means — depends not just on the direction of the wick, but on where it appears.
If a candle with a long lower wick appears in a lower price zone after a downtrend, it’s called a Hammer, signaling a possible bullish reversal. If the exact same shape appears in an upper price zone after an uptrend, it’s called a Hanging Man, and it becomes a warning sign of a bearish reversal instead.
Conversely, if a candle with a long upper wick appears in a lower price zone after a downtrend, it’s called an Inverted Hammer, also signaling a possible bullish reversal. If that same shape shows up in an upper price zone after an uptrend, it’s called a Shooting Star, warning of a bearish reversal.
In other words, a candle’s name and meaning aren’t determined by shape alone. You need to check the wick’s direction, the preceding trend, and where the candle appears — all together.
What Is a Hammer?
Price fell sharply during the period but recovered, leaving the body near the upper end of the range. This suggests that selling pressure pushed the price down before buyers stepped back in and reclaimed most of the decline.
| Component | Interpretation |
| Body | Upper portion of the range |
| Lower Wick | Roughly 2× body length or more |
| Upper Wick | Very short or absent |
| Color | Secondary reference only |
| Weakness | Failed rebound → decline may continue |
| Key check | Do following candles keep rising? |
A bullish body alone does not necessarily make the signal stronger. The actual likelihood of a rebound depends on multiple factors together: the severity of the prior decline, nearby support levels, trading volume, and the closing prices of subsequent candles.
What Is an Inverted Hammer?
The Inverted Hammer is essentially the shape above flipped upside down, but it shares the same condition of appearing in a lower price zone after a decline. During the trading period, price traded significantly higher, but both the open and close were located near the lower end of the candle’s full range.
This suggests that buyers attempted to push the price higher but met strong selling pressure near the highs.
| Component | Interpretation |
| Body | Lower portion of the range |
| Upper Wick | Roughly 2× body length or more |
| Lower Wick | Very short or absent |
| Color | Position and follow-through matter more |
| Weakness | Sold off at highs; rebound unconfirmed |
| Key check | Close > open, ideally > pattern high |
Same Shape, Different Meaning Depending on Position — Hanging Man and Shooting Star
As explained above, the same shape can be called something entirely different — with a different interpretation — depending on where it appears.
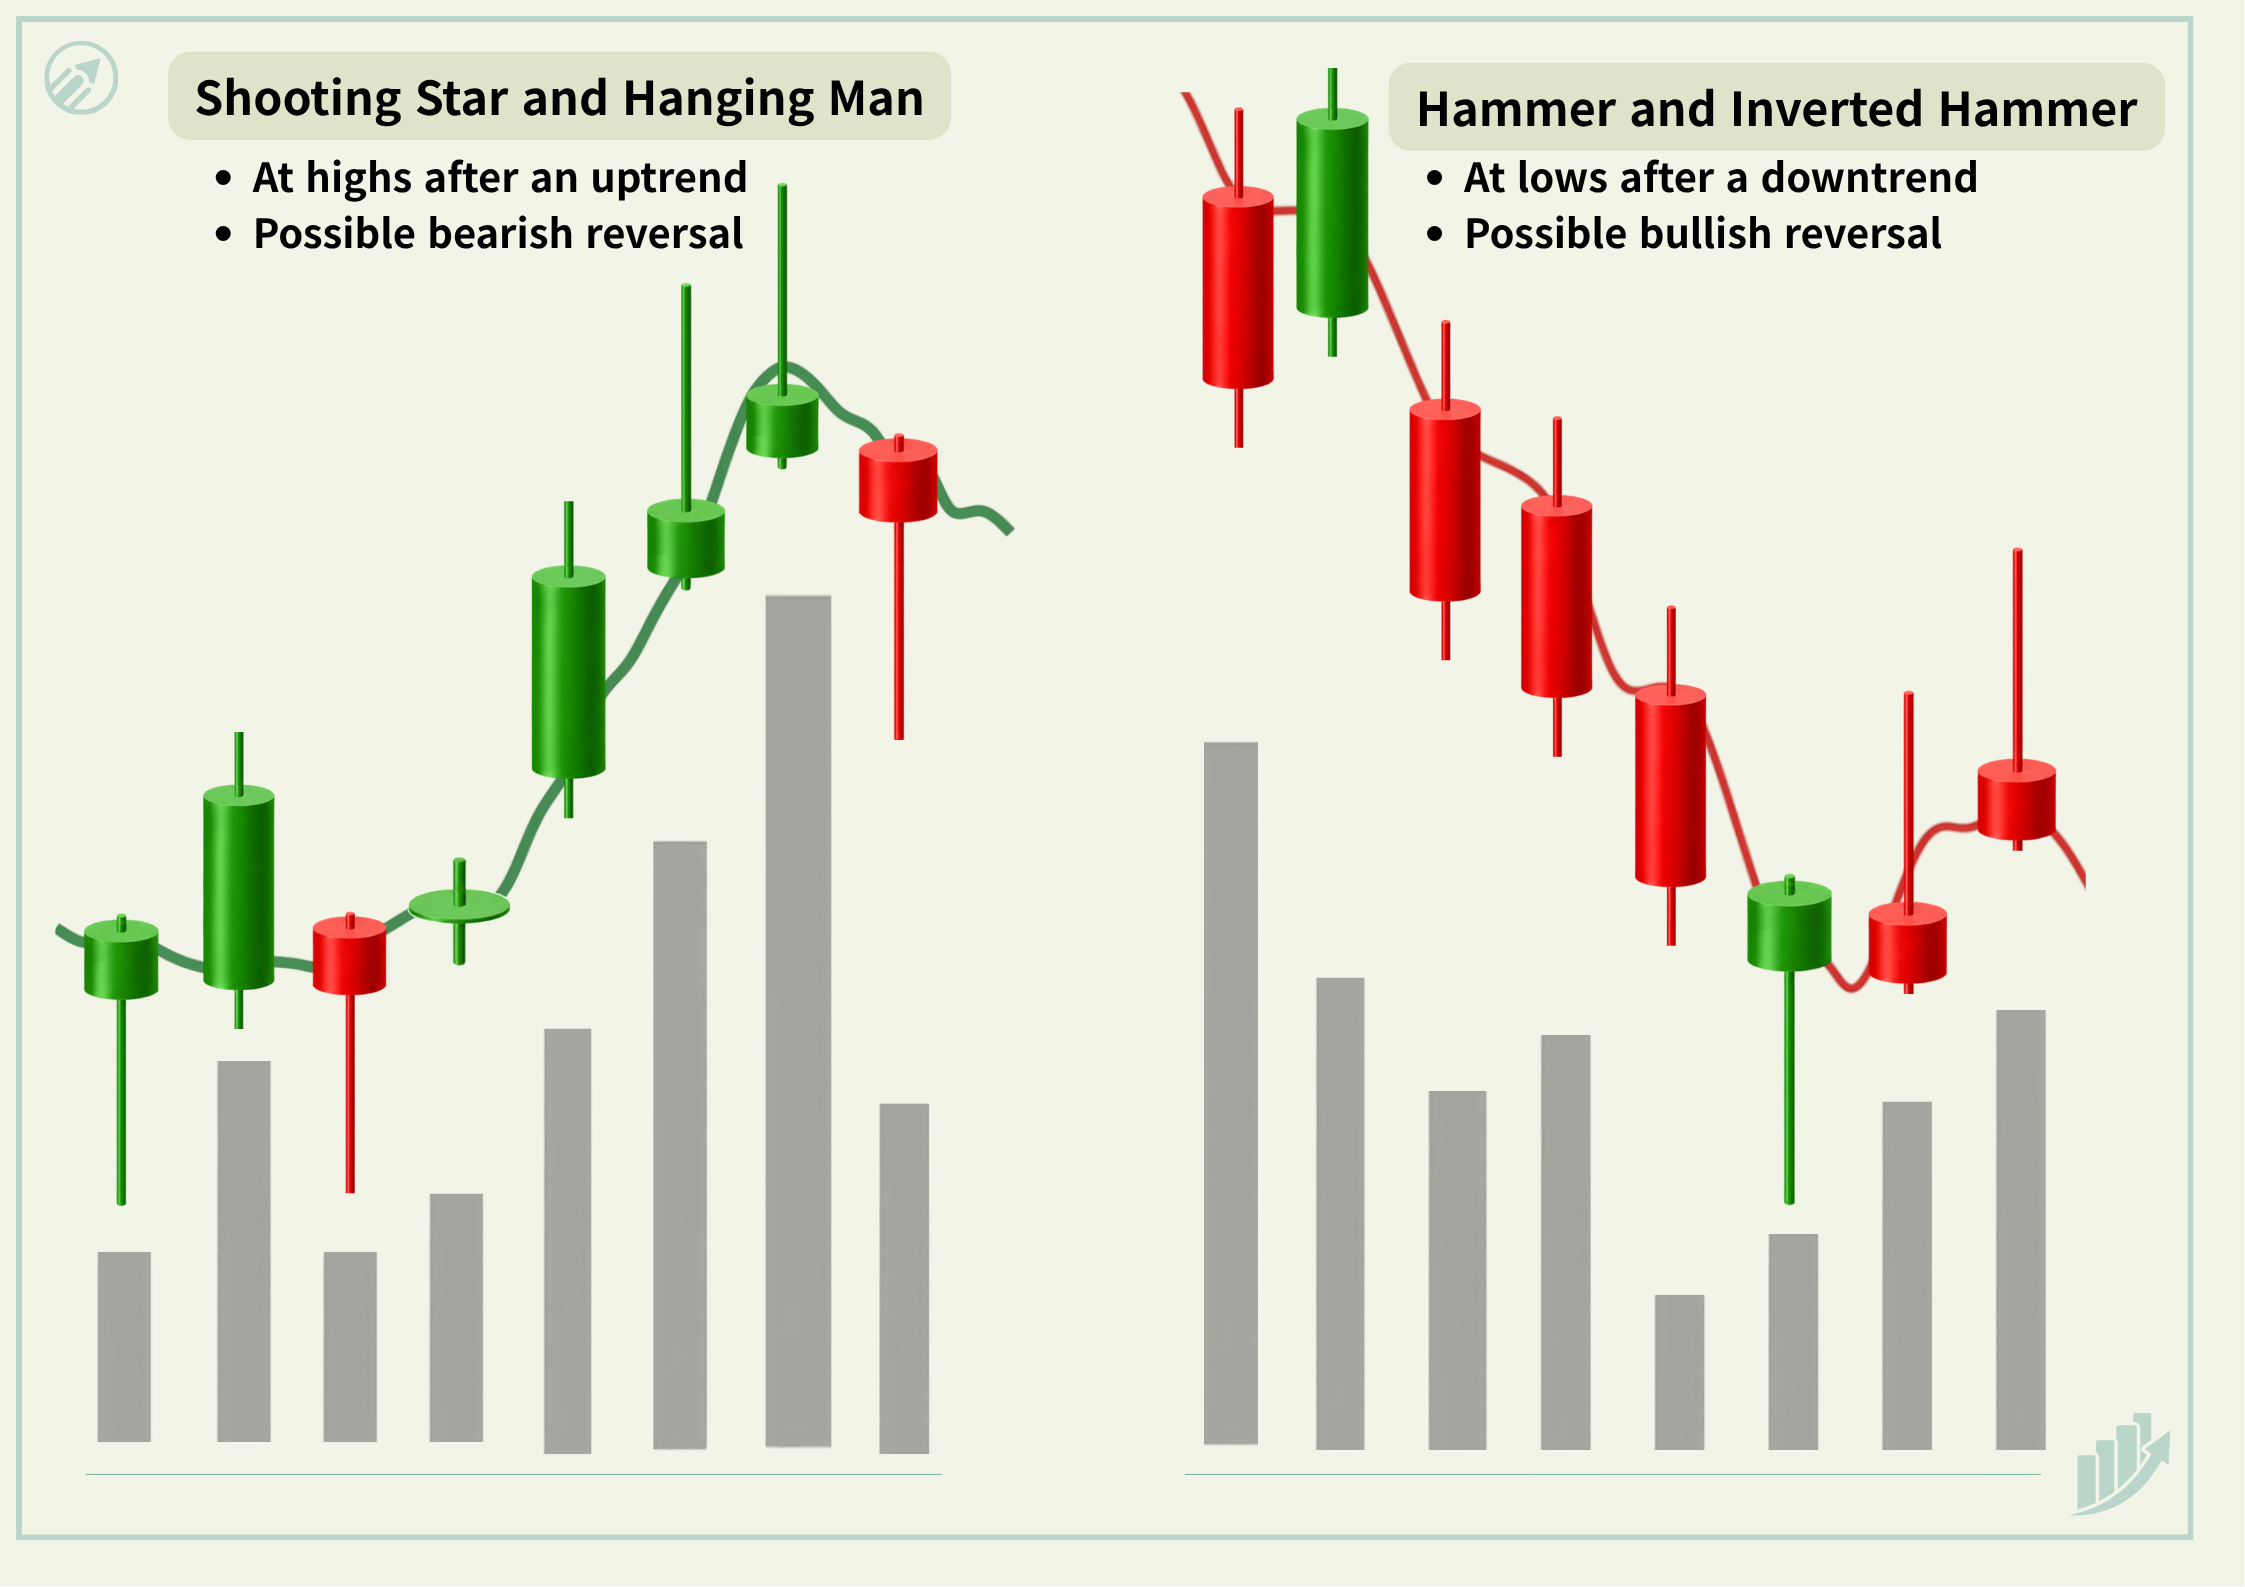
| Upper Zone After Uptrend | Lower Zone After Downtrend |
| Hanging Man : Bearish Warning | Hammer : Bullish Potential |
| Shooting Star : Bearish Warning | Inverted Hammer : Bullish Potential |
○ Hanging Man Near the Top of an Uptrend
When a Hanging Man appears near the top of an uptrend, it suggests that selling pressure may be starting to build. A following close below the Hanging Man’s low strengthens the bearish reversal signal.
○ Shooting Star Near the Top of an Uptrend
The Shooting Star forms when price attempts to push higher but meets strong selling pressure and gives back most of its gains. A following close below the Shooting Star’s low strengthens the bearish reversal signal.
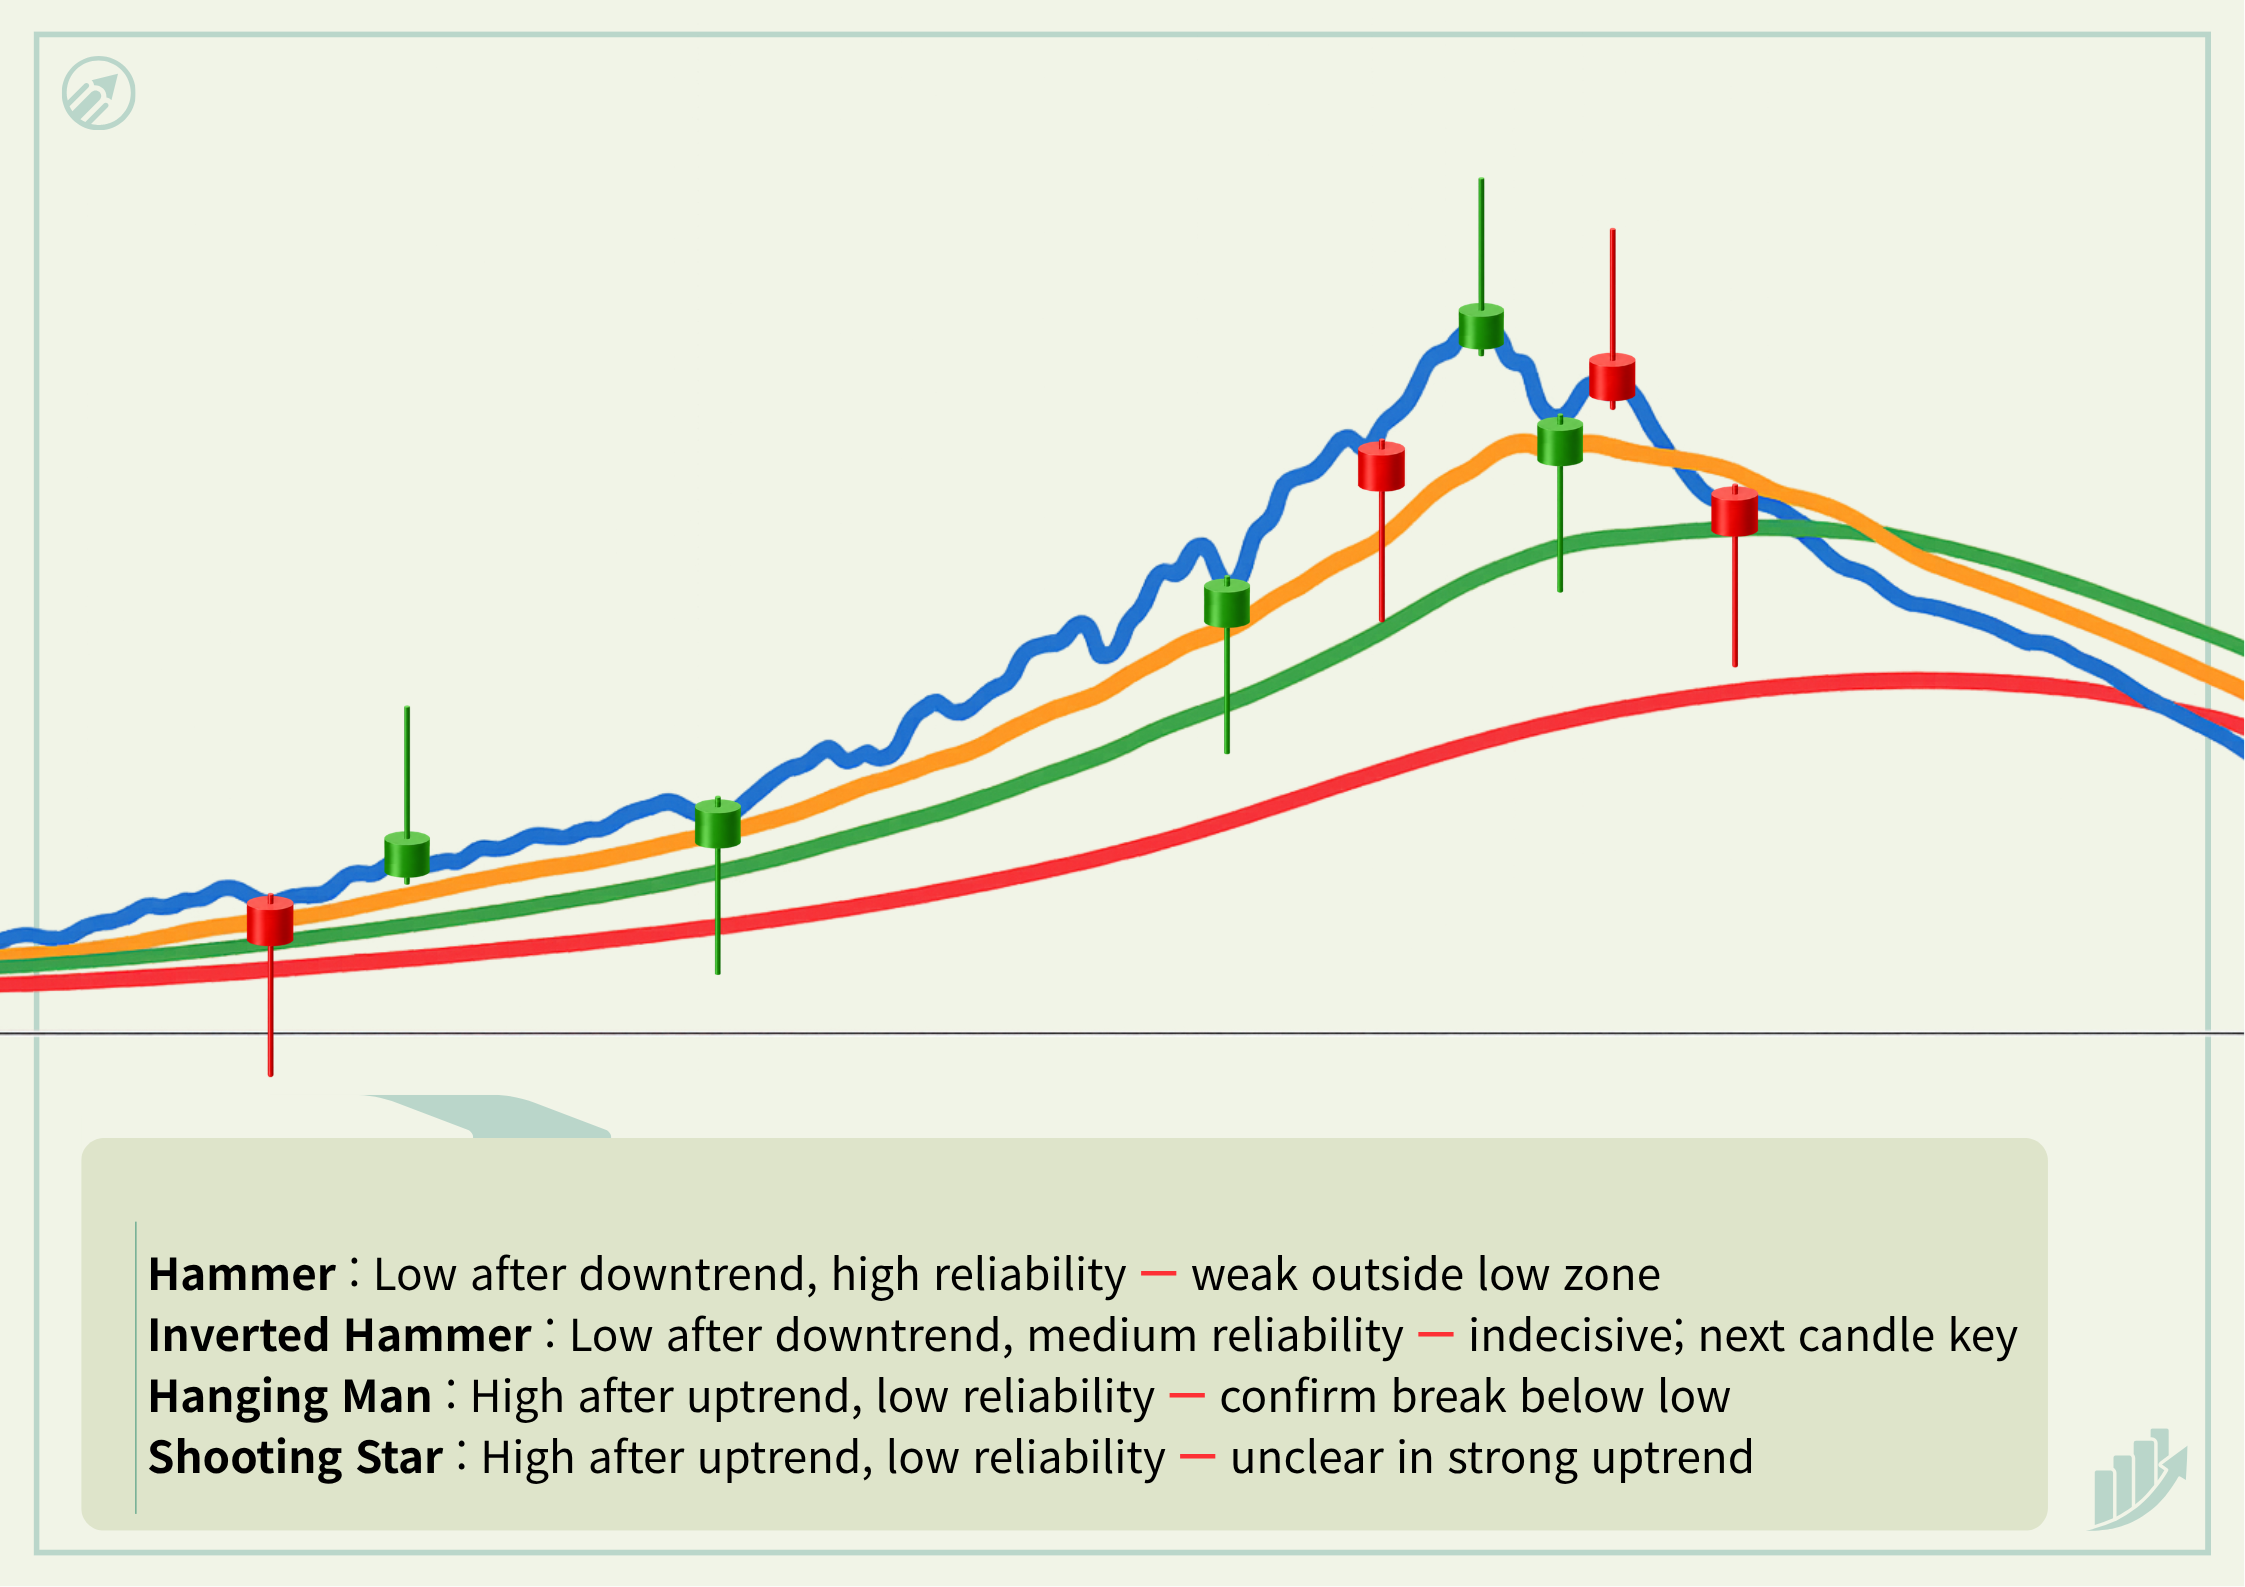
What Do “Lower Price Zone” and “Upper Price Zone” Actually Mean?
Lower and upper price zones are relative to recent price action, not absolute price. A zone near recent lows or support is considered a lower price zone, while one near recent highs or resistance is considered an upper price zone. Therefore, the same price level may represent either zone depending on the preceding price action.
Checkpoints to Confirm
- Position : Low after decline or high after rally?
- Shape : Wick at least 2× body?
- Level : Near key support or resistance?
- Volume : Increased trading volume?
- Confirmation : Bullish close above pattern high or bearish close below pattern low?
Don’t judge a rebound based on increased volume alone — you need to confirm both the candle’s position and the direction of the subsequent close together. If the following candle closes above its opening price, and especially if it closes above the high of the Hammer or Inverted Hammer, the probability of a rebound increases further. A bullish close itself is a positive development, but closing above that high is a stronger confirmation. Conversely, if price fails to continue rising and instead closes below the low of that candle, the reversal interpretation is significantly weakened.
Common Beginner Mistakes
- Calling it bullish from shape alone
- Ignoring the candle’s position
- Judging before the candle closes
- Assuming every bullish candle predicts a rise
- Reading an upper wick without full price context
- Trusting a high break before the next close
- Confusing an Inverted Hammer with a Shooting Star
- Keeping the reversal view after a close below the low
2. Is This the Start of a Reversal?
As covered in the previous section, basic candlesticks showed us how price moved through the open, high, low, and close. The Doji showed us the balance between buying and selling pressure. The Hammer and Inverted Hammer showed us how buying pressure may reappear during a decline and create the possibility of a bullish reversal.
This is simply the order in which these concepts are taught — it doesn’t mean that in an actual chart, one of these shapes will appear right after a Doji.
The actual order for checking these on a real chart is:
Preceding trend and position → Body size → Wick direction and length → Support or resistance zone → Volume → Direction of subsequent closes
The color of the body should only be considered a secondary reference.
Remember : a candlestick’s shape records what happened, but its signal becomes more reliable only when confirmed by subsequent price action.